14
Regional areas represented in the dashboard
Public Sector Data Project
Regional Digital Development Dashboard
An interactive data project designed to compare digital development across Uzbekistan's regions by bringing together indicators related to connectivity, human capital, ICT workforce capacity, and regional digital readiness.
14
Regional areas represented in the dashboard
3
Core dimensions used for regional comparison
1
Composite digital development index
Overview
Digital development is shaped by more than access to the internet. Connectivity, human capital, employment, ICT-sector activity, and access to digital infrastructure all contribute to how prepared a region is to participate in a digital economy.
The Uzbekistan Digital Development Index brings several of these indicators together in one interface. Instead of viewing individual datasets separately, the dashboard allows users to explore how multiple dimensions of digital development differ across regions.
The problem
Uzbekistan publishes a growing amount of regional statistical data, including information about internet access, mobile connectivity, employment, education, population, and the ICT sector.
However, these indicators are often presented as separate datasets. That makes it difficult to quickly understand how a region performs across several dimensions of digital development at the same time.
This project was created to bring selected indicators into a single regional analytical framework and make the resulting patterns easier to communicate visually.
Core capabilities
Digital development indicators are organized by region, making it possible to compare performance across Uzbekistan.
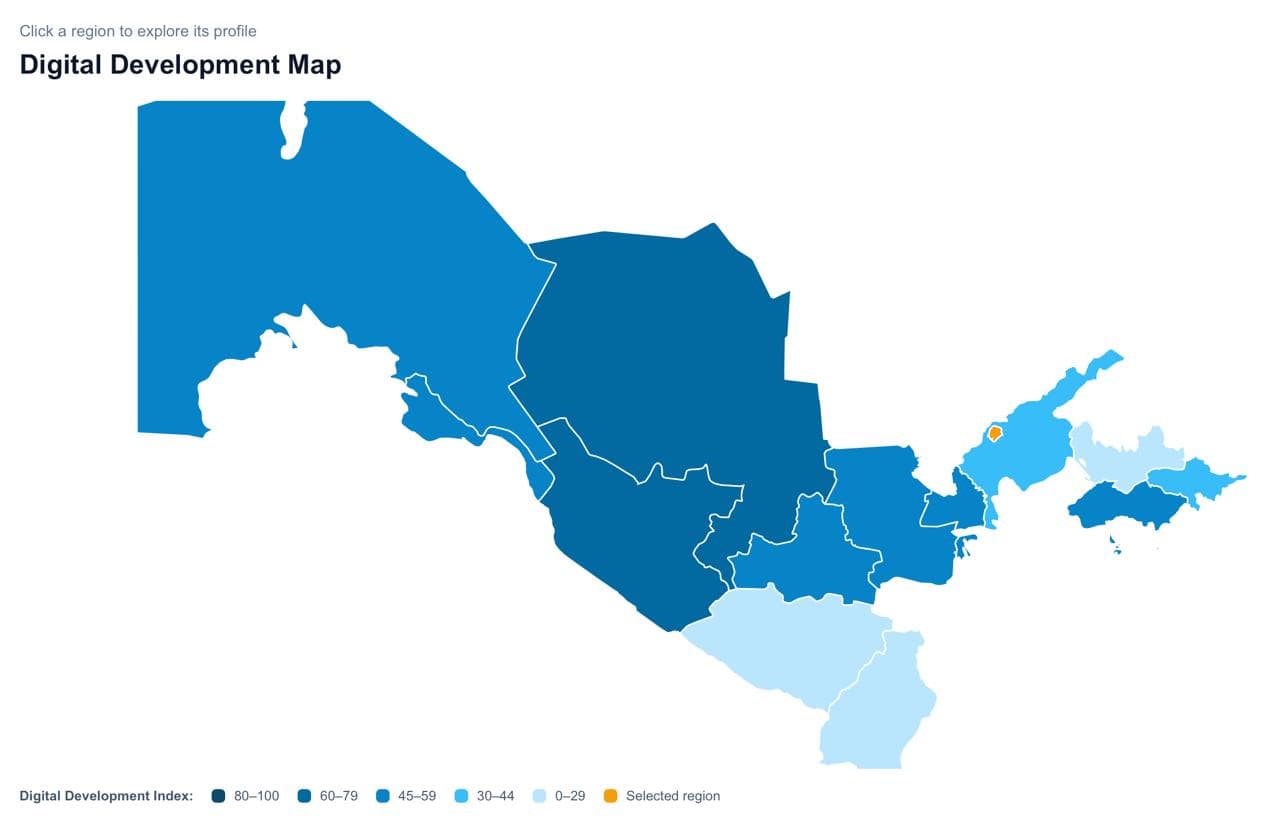
A geographic interface allows users to select individual regions and explore their digital development profiles.
Multiple digital indicators are brought together into a regional index that summarizes broader digital development performance.
The dashboard incorporates human-capital and workforce indicators alongside digital infrastructure metrics.
Data
The analysis uses public statistical datasets covering several aspects of Uzbekistan's digital economy and population. Indicators considered during the project included internet access, broadband subscriptions, mobile connectivity, ICT-sector employment, information and communication activity, population, employment, and higher-education graduates.
These datasets were organized by region and transformed into a structure that could support consistent comparison inside the dashboard.
Methodology
Selected indicators were grouped into broader dimensions representing regional digital development. The dashboard focuses on the overall index together with human-capital and workforce measures.
The purpose of the index is not to replace the underlying statistics. Instead, it provides a compact way to compare multiple signals while still allowing users to inspect regional differences through the interactive interface.
Tashkent City is also treated separately in several comparisons because its economic scale and concentration of digital activity make direct comparison with other regions less informative.
My contribution
Collected and organized public datasets describing internet access, connectivity, population, higher-education graduates, employment, and the ICT sector across Uzbekistan.
Structured the selected indicators into comparable dimensions and created a digital development index for regional analysis.
Designed and implemented an interactive interface that combines regional statistics, ranking information, and map-based exploration.
Translated multiple public datasets into a visual format intended to make regional digital disparities easier to interpret.
Technology