4
Primary visual analyses presented
Data Analysis Project
Exploratory Analysis of Beverage Nutrition
An exploratory analysis of Starbucks beverage nutrition data created to examine calorie distributions, compare nutritional characteristics across beverage categories, and investigate how calories relate to total fat and other nutrients.
4
Primary visual analyses presented
1
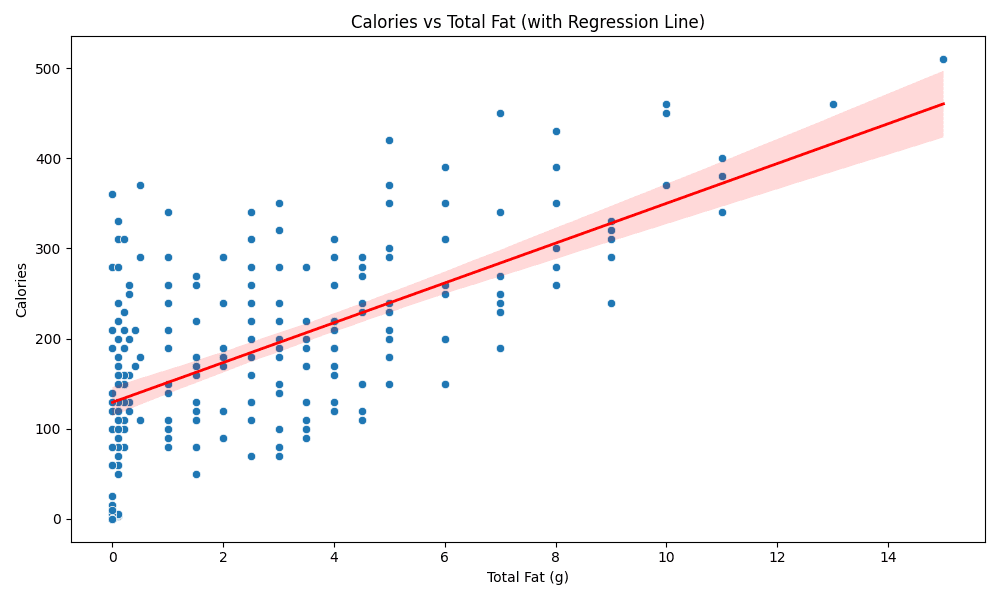
Regression relationship examined
9
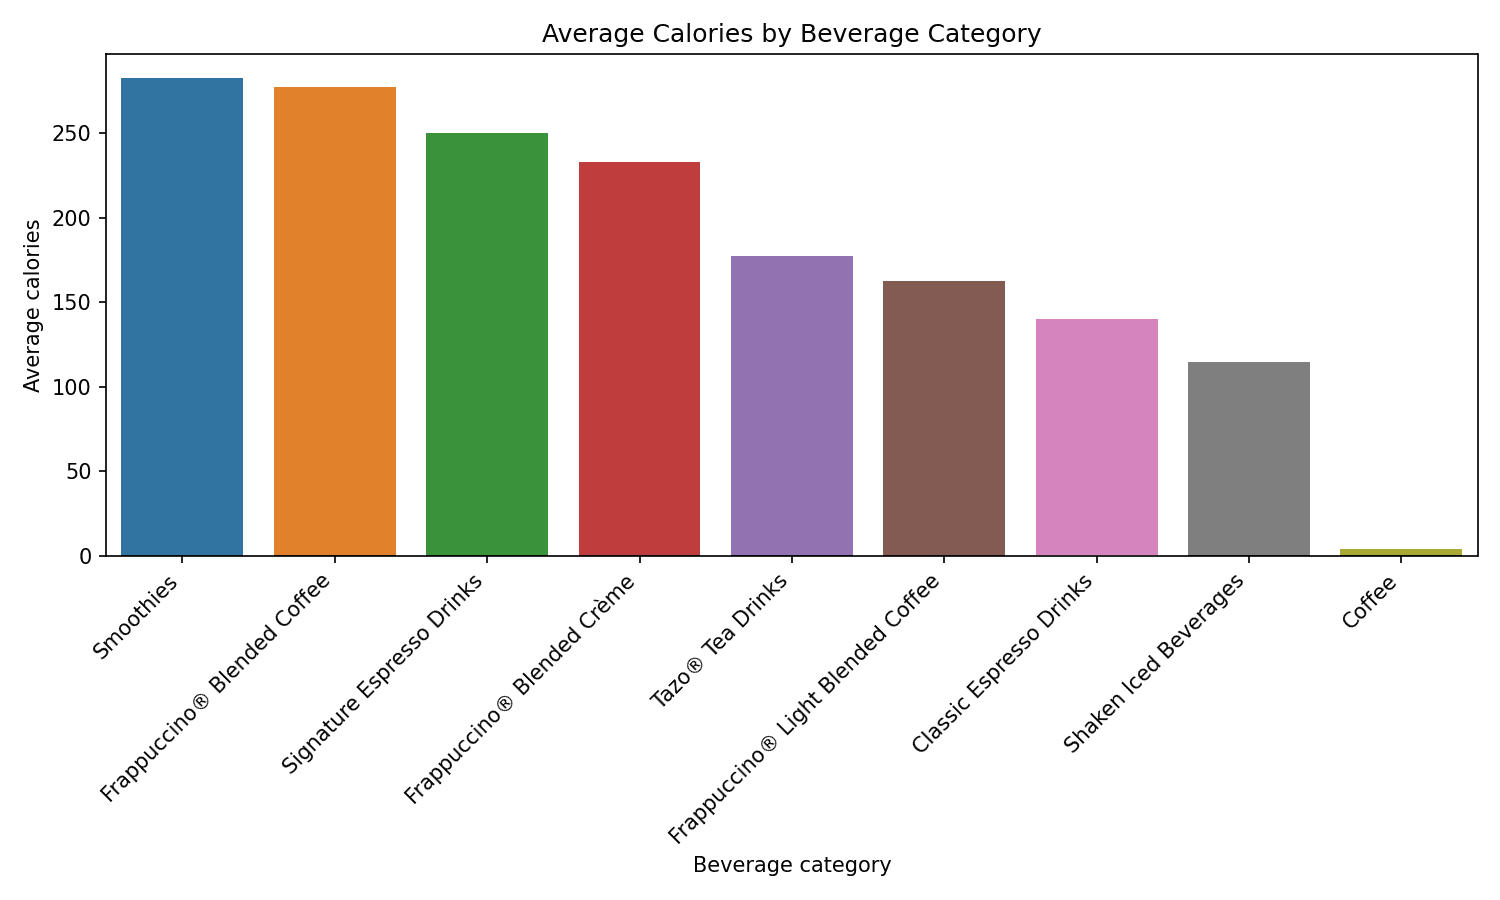
Beverage categories compared
Objective
The project explored how calorie values vary across Starbucks beverages and how calories relate to nutritional variables such as total fat and sugar.
The analysis also compared beverage categories and examined the overall distribution of calorie values to make differences across the menu easier to understand.
Analytical workflow
Selected a real-world Starbucks nutrition dataset containing beverage names, categories, calories, fat, sugar, and related nutritional information.
Reviewed the dataset structure, checked variable types, and prepared numerical and categorical fields for analysis and visualization.
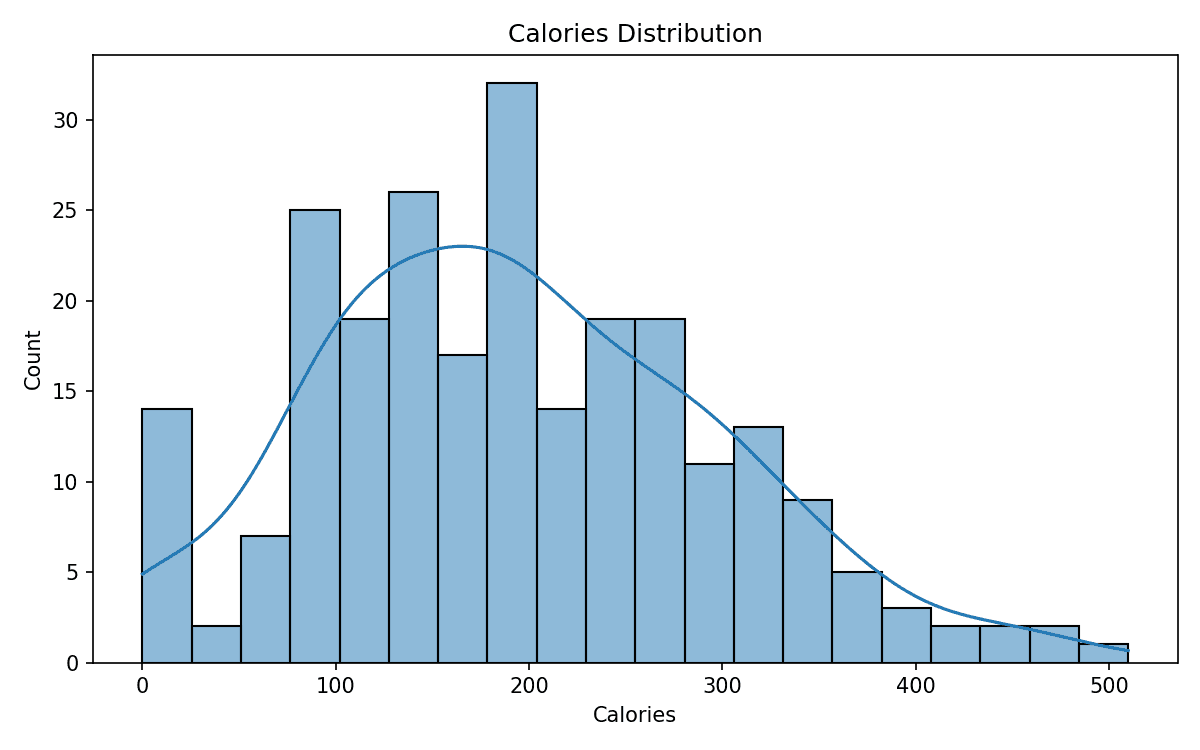
Examined the overall calorie distribution to understand where most beverages were concentrated and identify higher-calorie menu items.
Used a scatter plot and regression line to evaluate the relationship between total fat and calories across beverages.
Compared average calorie values across beverage categories to identify meaningful differences between drink groups.
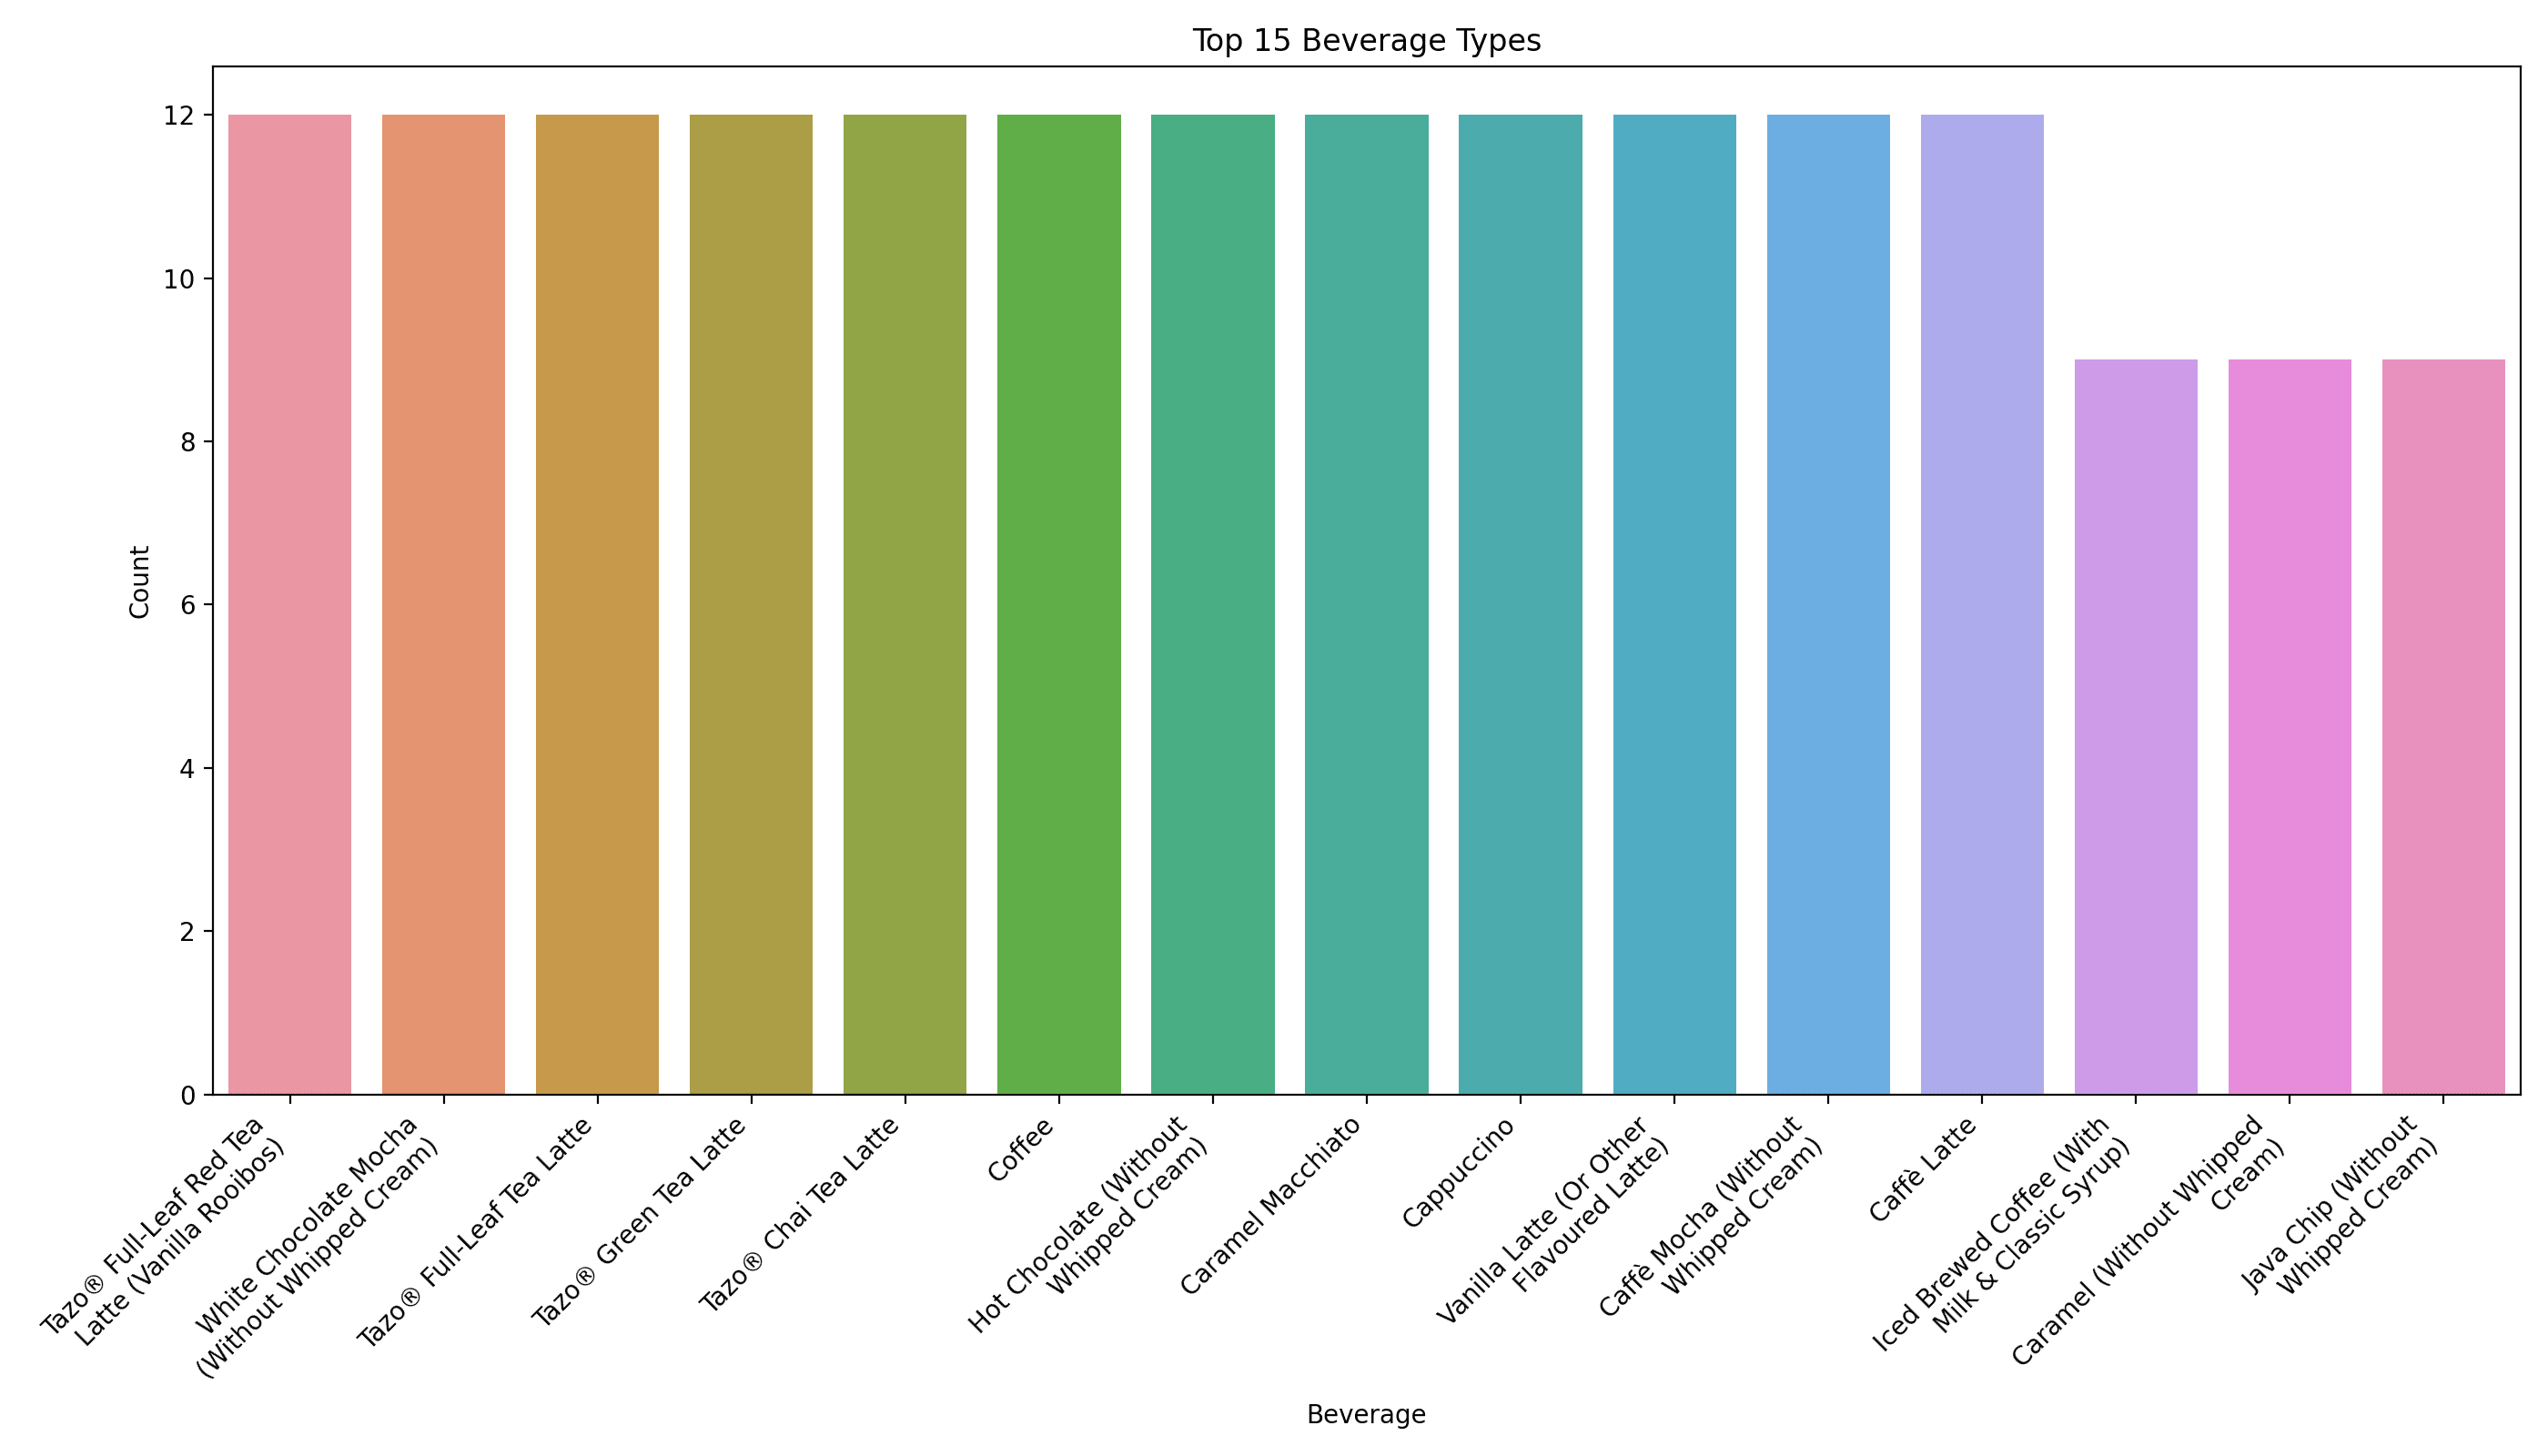
Produced clear charts that communicate patterns in beverage representation, calorie content, and nutritional relationships.
Calorie distribution
Category comparison
Beverage representation
Key findings
Calories and total fat show a clear positive relationship across the beverages represented in the dataset.
Most beverages fall within the lower-to-middle calorie range, while relatively few items appear at the highest calorie levels.
Average calorie content differs substantially across beverage categories.
Smoothies and blended coffee drinks appear among the higher-calorie categories in this dataset.
Plain coffee has a much lower average calorie value than most prepared or blended beverage categories.
Interpretation
The positive relationship between calories and total fat indicates that beverages with more fat tend to contain more calories. However, the analysis is observational and does not establish that fat alone determines total calorie content.
Other ingredients, including sugar, milk, syrups, toppings, and serving size, can also contribute substantially to nutritional differences.
Limitations
The dataset describes menu items rather than actual customer purchasing or consumption behavior. It cannot show which beverages are ordered most frequently.
Customizations such as alternative milk, additional syrup, whipped cream, and serving-size changes may produce nutritional values that differ from the standardized menu records.
The dataset may also represent a particular version of the Starbucks menu and may not include later menu changes or regional differences.
Technology