254
Restaurant transactions analyzed
Machine Learning Project
Transaction analysis and classification-model comparison
An end-to-end machine learning project designed to identify factors associated with high-value restaurant sales and compare classification models for predicting transaction performance.
254
Restaurant transactions analyzed
4
Classification models evaluated
2
Engineered sales variables
Problem
The project examined transaction-level characteristics including price, quantity sold, purchase type, city, payment method, and manager.
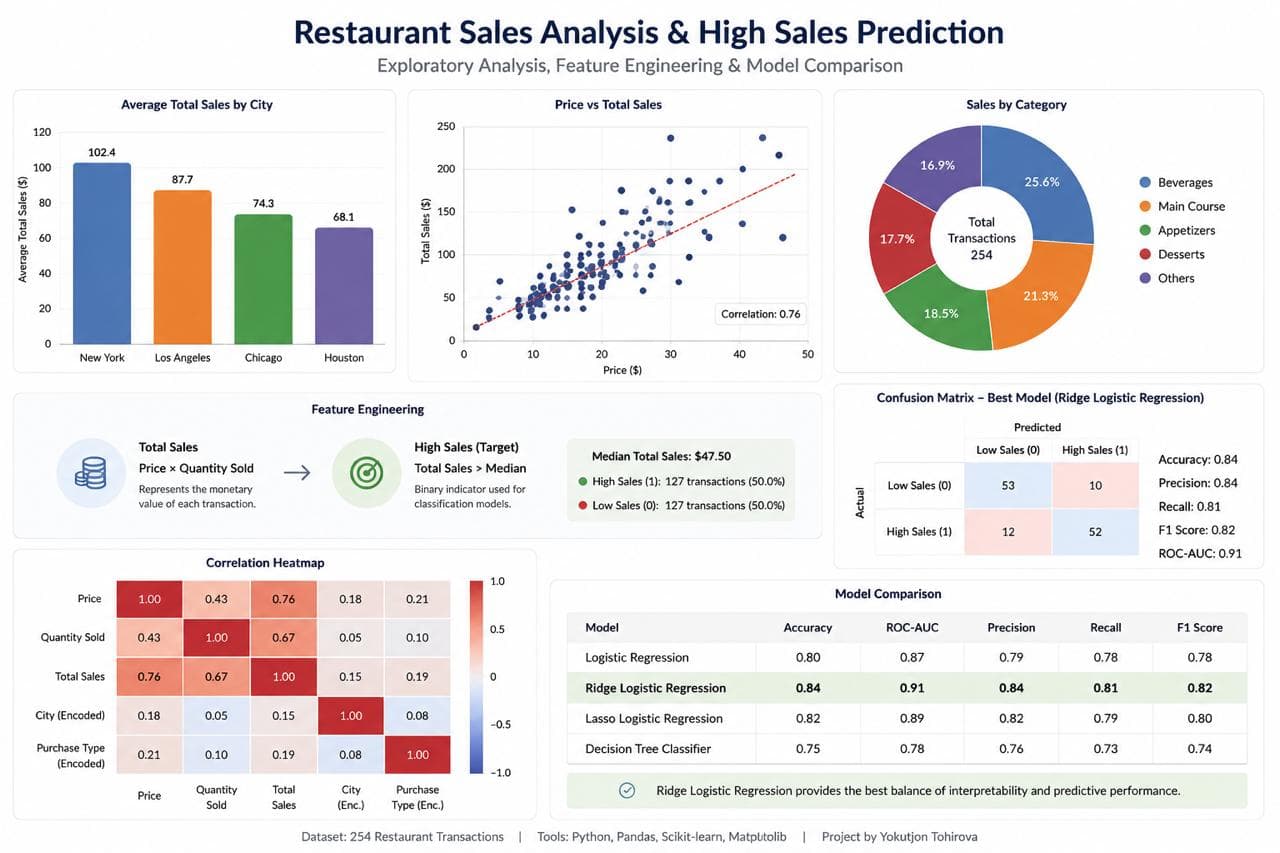
The main classification objective was to predict whether a transaction's total sales exceeded the median sales value. This converted the business question into a reproducible binary classification task.
Methodology
Cleaned the transaction data, reviewed missing values, corrected data types, and prepared numerical and categorical variables for analysis.
Created total_sales by multiplying price by quantity sold, then created a binary high_sales target using the median total-sales value.
Trained logistic regression, ridge logistic regression, lasso logistic regression, and decision-tree classification models.
Compared model accuracy, interpretability, stability, complexity, and potential overfitting to identify the most appropriate approach.
Feature engineering
Total sales
Price × Quantity Sold
Represents the monetary value of each transaction.
High sales
Total Sales > Median
Creates the binary target used by the classification models.
Key findings
Price and quantity sold were important indicators of high-value transactions.
Purchase type and city also contributed meaningful predictive information.
Logistic regression provided a strong and interpretable baseline model.
Regularized logistic regression offered the best balance of stability, complexity, and interpretability.
The decision tree captured nonlinear relationships but was more vulnerable to overfitting because of the small dataset.
Limitations
The dataset contained 254 transactions, so the evaluation results should be interpreted cautiously. A model can appear accurate on a small test set while performing differently on new business data.
Additional transactions, repeated cross-validation, broader feature coverage, and testing across multiple restaurants would strengthen future analysis.
Technology