10,000+
Sensors represented across Biosphere 2 environments
Senior Capstone Project
Digital Twin of Biosphere 2
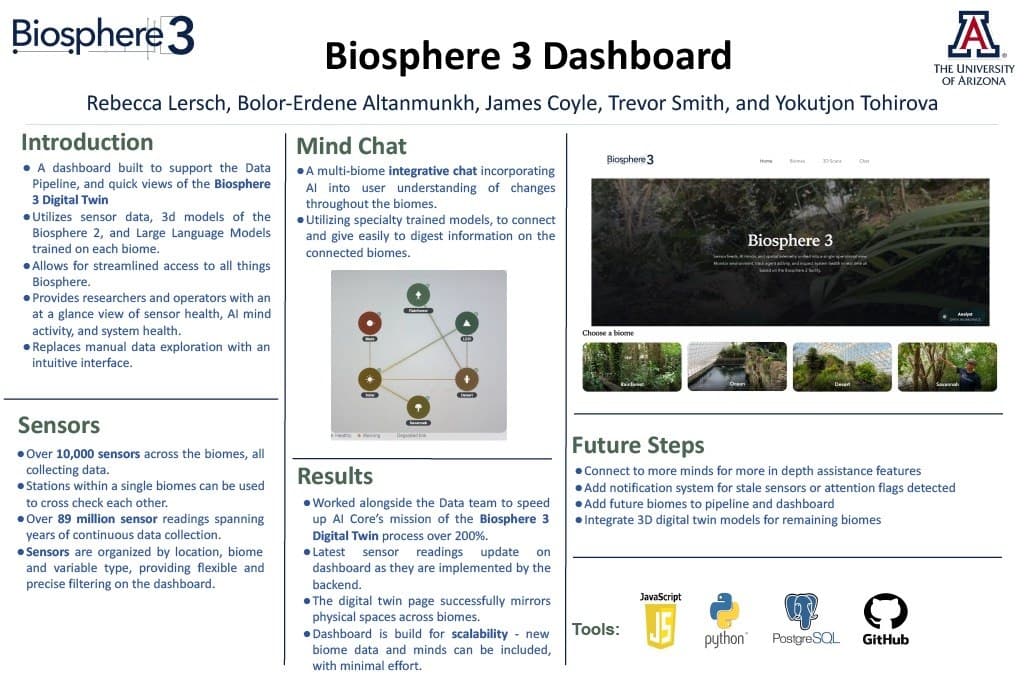
A digital-twin platform designed to make Biosphere 2's environments, sensor systems, infrastructure conditions, and AI-assisted analysis accessible through one operational interface.
10,000+
Sensors represented across Biosphere 2 environments
89M+
Historical sensor readings available to the project
4
Primary biome environments presented in the interface
Overview
Biosphere 2 contains multiple controlled environments and an extensive network of sensors. Biosphere 3 was created as a digital layer that makes information from those systems easier to explore, interpret, and monitor.
The interface brings together biome exploration, sensor information, system-health views, spatial content, and AI-assisted analysis. This reduces the need for users to move between disconnected technical systems.
Core capabilities
Dedicated digital views for Biosphere 2 environments, including the rainforest, ocean, desert, and savannah.
Sensor information organized by environment, location, measurement type, freshness, and operating condition.
Operational conditions presented through service views, status indicators, timelines, and data visualizations.
A context-aware analyst architecture designed to interpret dashboard state and return evidence-grounded insights.
My contribution
Contributed to the structure of the digital-twin interface, connecting biome navigation, monitoring views, and analytical tools.
Helped create dashboard experiences that translate complex environmental and sensor information into readable operational views.
Focused on presenting large volumes of technical information through clear hierarchy, visualization, and interaction patterns.
Technology